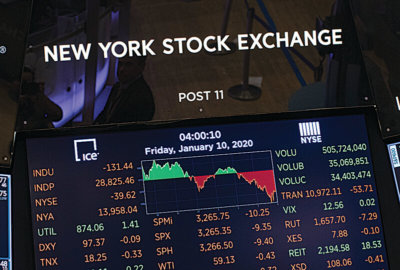
KUWAIT CITY: Kuwait’s exports hit KD 3.5 billion in the second quarter of 2016, down 25.8 percent, compared with April-June 2015, according to the country’s Central Administration of Statistics (CAS).
In the same period, volume of trade decreased 17.6% compared with the second quarter of 2015. Trade of volume was KD 5.9 billion KD in April-June 2016 while it was KD 7.1 billion in April-June 2015, it said in a press statement to KUNA.
Coverage rate was 150.8% in April-June 2016, while it was 200.6% in April-June 2015. In the second quarter of 2016, Coverage rate (excluding oil) was 15.6% while it was 20.1% in the second quarter of 2015, it added.
For April-June 2016, the top categories for exports were “mineral fuels and oils” (KD 3.1 billion) with share of 89.7% and then “organic chemicals” (KD 77.9 million) 2.2%, “plastics and articles thereof” (KD 60 million) 1.7%.
At the same period, “boilers, machinery and mechanical appliances; parts thereof” has by far the highest value imported at (KD 327.4 million) with share of 13.9% and then, “vehicles other than railway or tramway rolling-stock, parts thereof” (KD 279.3 million) 11.8%, “electrical machinery and equipment and parts thereof; sound recorders and reproducers, television image and sound recorders and reproducers, and parts and accessories of such articles” (KD 272 million) 11.5%, and “articles of iron and steel” (KD 135.6 million) 5.7%, it said.
In April-June 2016, the main partner country for non-oil exports was India with (KD 62.5 million). For exports, India was followed by Saudi Arabia (KD 52.6 million), UAE (KD 48.1 million) and China (KD 37.2 million).
The top country for Kuwait’s imports was China (KD 361.1 million), records for imports range from United States of America (KD 217.2 million), UAE (KD 215.6 million) and Germany (KD 160.5 million), it noted.
As compared with the same quarter of the previous year, exports to the GCC countries were KD 133 million, while it was KD 157.7 million, and decreased by 15.6%. The share of the GCC countries was 3.7% in April-June 2016 while it was also 3.3% in April-June 2015.
During the same period, 28% of imports products were industrial supplies. As compared with the same period of the previous year; Industrial supplies increased 15.6% and Capital goods increased by 12.2% while Food and beverages decreased by 12.7%, it added.