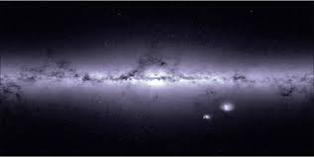


NEW YORK: This image, based on housekeeping data from ESA’s Gaia satellite, is no ordinary depiction of the heavens. While the image portrays the outline of our Galaxy, the Milky Way, and of its neighbouring Magellanic Clouds, it was obtained in a rather unusual way.
As Gaia scans the sky to measure positions and velocities of a billion stars with unprecedented accuracy, for some stars it also determines their speed across the camera’s sensor. This information is used in real time by the attitude and orbit control system to ensure the satellite’s orientation is maintained with the desired precision.
These speed statistics are routinely sent to Earth, along with the science data, in the form of housekeeping data. They include the total number of stars, used in the attitude-control loop, that is detected every second in each of Gaia’s fields of view.
It is the latter – which is basically an indication of the density of stars across the sky – that was used to produce this uncommon visualisation of the celestial sphere. Brighter regions indicate higher concentrations of stars, while darker regions correspond to patches of the sky where fewer stars are observed.
The plane of the Milky Way, where most of the Galaxy’s stars reside, is evidently the brightest portion of this image, running horizontally and especially bright at the centre. Darker regions across this broad strip of stars, known as the Galactic Plane, correspond to dense, interstellar clouds of gas and dust that absorb starlight along the line of sight.

Pakistan to get $3b loan from Islamic Trade Financing Corporation
ISLAMABAD: Islamic Trade Financing Corporation (ITFC) to provide Pakistan with a $3 billion loan, according to an official statement released...